National Cheng Kung UniversityLAiMM Laboratory

W07 · H1 · 14:00–15:00 · 19 October 2026

Sequential Data and LSTM

How do models turn ordered observations into useful memory?

Machine Learning in Engineering Science Fall 2026 · Week 07 · Hour 1 Chi-Hua Jonny Yu · NCKU / LAiMM


OBSERVE IN ORDERHistory windowLSTM memoryNext valueKeep · write · exposeA model of memory, not just a fitted curve
Mechanism diagram / illustrative teaching values
Machine Learning in Engineering Science · 19 Oct 202600:00–02:00 · 01/30
National Cheng Kung UniversityLAiMM Laboratory

W07 · H1 · Machine Learning in Engineering Science

This hour: from sequences to memory

Define a valid sequence task, then explain and test how LSTM stores information.

Goal: trace one cell update and judge a forecast.

00–18 minSequence task + honest data18–38 minRNN limits + LSTM gates38–56 minNotebook + baseline evidence56–60 minLimits + summary
Mechanism diagram / illustrative teaching values
Machine Learning in Engineering Science · 19 Oct 202602:00–04:00 · 02/30
National Cheng Kung UniversityLAiMM Laboratory

W07 · H1 · Machine Learning in Engineering Science

The same values can tell different stories

A sequence contains both values and an ordering rule.

[1, 2, 4, 8] ≠ [8, 1, 4, 2]

What remains identical after shuffling?

The multiset and mean; adjacency, trend, and time-dependent structure can change.

1 → 2 → 4 → 8A8 → 1 → 4 → 2B
Mechanism diagram / illustrative teaching values
Machine Learning in Engineering Science · 19 Oct 202604:00–06:00 · 03/30
National Cheng Kung UniversityLAiMM Laboratory

W07 · H1 · Machine Learning in Engineering Science

Define the forecast origin

The prediction must use only information available at its origin.

history: x[t−L:t] target: x[t]

t−4t−3t−2t−1tWindow 1t−3t−2t−1tt+1Window 2t−2t−1tt+1t+2Window 3History shifts forward; target stays excluded
Mechanism diagram / illustrative teaching values
Machine Learning in Engineering Science · 19 Oct 202606:00–08:00 · 04/30
National Cheng Kung UniversityLAiMM Laboratory

W07 · H1 · Machine Learning in Engineering Science

One sample is an entire window

Sequence models receive a batch of histories, with features at every time step.

X ∈ ℝᴮˣᵀˣᶠ

B = 4 historiesT = 24 samplesF = 1 sensor
Mechanism diagram / illustrative teaching values
Machine Learning in Engineering Science · 19 Oct 202608:00–10:00 · 05/30
National Cheng Kung UniversityLAiMM Laboratory

W07 · H1 · Machine Learning in Engineering Science

Targets determine the output structure

Many-to-one predicts one value; many-to-many predicts a value at multiple positions.

24 sensor samples → one forecastAtoken sequence → shifted token sequenceB
Mechanism diagram / illustrative teaching values
Machine Learning in Engineering Science · 19 Oct 202610:00–12:00 · 06/30
National Cheng Kung UniversityLAiMM Laboratory

W07 · H1 · Machine Learning in Engineering Science

Split time before selecting a model

Train on earlier targets, select on later validation, then evaluate on test.

train < validation < test

TrainingTrain: t < 960ValidationValidation: 960–1279TestTest: 1280–1599Time increases →
Mechanism diagram / illustrative teaching values
Machine Learning in Engineering Science · 19 Oct 202612:00–14:00 · 07/30
National Cheng Kung UniversityLAiMM Laboratory

W07 · H1 · Machine Learning in Engineering Science

Fit normalization on the training past

Global means and variances can reveal future distribution information.

z = (x − μtrain) / σtrain

Past training samplesFit μ and σFreeze transformLater observations
Mechanism diagram / illustrative teaching values
Machine Learning in Engineering Science · 19 Oct 202614:00–16:00 · 08/30
National Cheng Kung UniversityLAiMM Laboratory

W07 · H1 · Machine Learning in Engineering Science

Persistence is a serious baseline

Predict the next observation using the last known observation.

ŷ[t] = x[t−1]

1t11.4t21.7t31.6t41.9t51.9t6Order is part of the input
Mechanism diagram / illustrative teaching values
Machine Learning in Engineering Science · 19 Oct 202616:00–18:00 · 09/30
National Cheng Kung UniversityLAiMM Laboratory

W07 · H1 · Machine Learning in Engineering Science

A recurrent state summarizes the past

An RNN applies the same state-update parameters at every time step.

hₜ = tanh(Wₓxₜ + Wₕhₜ₋₁ + b)

state 1x₁state 2x₂state 3x₃state 4x₄Shared update parameters across timePast → running state → later state
Mechanism diagram / illustrative teaching values
Machine Learning in Engineering Science · 19 Oct 202618:00–20:00 · 10/30
National Cheng Kung UniversityLAiMM Laboratory

W07 · H1 · Machine Learning in Engineering Science

Learning must cross the time chain

Backpropagation through time multiplies Jacobians along earlier states.

∂hₜ/∂hₜ₋ₖ = Jₜ Jₜ₋₁ … Jₜ₋ₖ₊₁

f = 0.5f = 0.9f = 1.0Steps backward: 0 → 100Direct-path factor fᵏ
Mechanism diagram / illustrative teaching values
Machine Learning in Engineering Science · 19 Oct 202620:00–22:00 · 11/30
National Cheng Kung UniversityLAiMM Laboratory

W07 · H1 · Machine Learning in Engineering Science

LSTM adds a separate memory path

The cell state carries memory; the hidden state exposes a filtered view.

cell: cₜ hidden output: hₜ

TWO STATES, TWO DIFFERENT JOBScₜ₋₁Cell updatecₜCarry memory forwardtanh + output gatehₜ: exposed representationxₜ and hₜ₋₁
Mechanism diagram / illustrative teaching values
Machine Learning in Engineering Science · 19 Oct 202622:00–24:00 · 12/30
National Cheng Kung UniversityLAiMM Laboratory

W07 · H1 · Machine Learning in Engineering Science

A gate is a learned vector of coefficients

Sigmoid outputs values between zero and one for each hidden dimension.

σ(z) = 1 / (1 + exp(−z))

Preactivation z: −6 → +610Sigmoid gate response
Mechanism diagram / illustrative teaching values
Machine Learning in Engineering Science · 19 Oct 202624:00–26:00 · 13/30
National Cheng Kung UniversityLAiMM Laboratory

W07 · H1 · Machine Learning in Engineering Science

The forget gate controls retained memory

Multiply the previous cell state by a learned forget coefficient.

fₜ = σ(Wf [hₜ₋₁; xₜ] + bf)

KEEP A FRACTION OF OLD MEMORYold c = 0.80× 0retained = 0.00old c = 0.80× 0.5retained = 0.40old c = 0.80× 0.9retained = 0.72f is learned from [hₜ₋₁; xₜ], dimension by dimension
Mechanism diagram / illustrative teaching values
Machine Learning in Engineering Science · 19 Oct 202626:00–28:00 · 14/30
National Cheng Kung UniversityLAiMM Laboratory

W07 · H1 · Machine Learning in Engineering Science

The input gate controls the write

A candidate proposes content; the input gate scales how much is written.

iₜ = σ(Wi [hₜ₋₁; xₜ] + bi) gₜ = tanh(Wg [hₜ₋₁; xₜ] + bg)

PROPOSE CONTENT, THEN SCALE THE WRITEInput [hₜ₋₁; xₜ]sigmoid → i = 0.20tanh → g = −0.50i × g = −0.10A nonnegative gate can write negative candidate content
Mechanism diagram / illustrative teaching values
Machine Learning in Engineering Science · 19 Oct 202628:00–30:00 · 15/30
National Cheng Kung UniversityLAiMM Laboratory

W07 · H1 · Machine Learning in Engineering Science

The cell update adds two paths

Retain selected old memory and add selected new content.

cₜ = fₜ ⊙ cₜ₋₁ + iₜ ⊙ gₜ

MEMORY IS AN ADDITIVE UPDATERetain: 0.90 × 0.80Write: 0.20 × (−0.50)+0.72−0.10New c = 0.62⊙ means multiply corresponding vector coordinates
Mechanism diagram / illustrative teaching values
Machine Learning in Engineering Science · 19 Oct 202630:00–32:00 · 16/30
National Cheng Kung UniversityLAiMM Laboratory

W07 · H1 · Machine Learning in Engineering Science

The output gate exposes memory

The hidden state is a bounded, gated view of the updated cell.

oₜ = σ(Wo [hₜ₋₁; xₜ] + bo) hₜ = oₜ ⊙ tanh(cₜ)

EXPOSURE CAN CHANGE WITHOUT REWRITING cCell c = 0.62tanh(c) ≈ 0.551o = 0.00h ≈ 0.000o = 0.70h ≈ 0.386o = 1.00h ≈ 0.551Same cell content; different visible hidden output
Mechanism diagram / illustrative teaching values
Machine Learning in Engineering Science · 19 Oct 202632:00–34:00 · 17/30
National Cheng Kung UniversityLAiMM Laboratory

W07 · H1 · Machine Learning in Engineering Science

Trace one numerical cell update

Chosen gates make every intermediate step visible.

0.9 × 0.8 + 0.2 × (−0.5) = 0.62

What is the hidden output?

h = 0.7 × tanh(0.62) ≈ 0.386.

Retain0.90 × 0.80 = 0.72Write0.20 × (−0.50) = −0.10Update0.72 − 0.10 = 0.62Expose0.70 × tanh(0.62) ≈ 0.386
Mechanism diagram / illustrative teaching values
Machine Learning in Engineering Science · 19 Oct 202634:00–36:00 · 18/30
National Cheng Kung UniversityLAiMM Laboratory

W07 · H1 · Machine Learning in Engineering Science

Predict before moving a gate

A high forget coefficient does not prevent new content from changing memory.

cnew = f × cold + i × g

cell = 0.620; hidden ≈ 0.386
Interactive chosen values — change one variable
Machine Learning in Engineering Science · 19 Oct 202636:00–38:00 · 19/30
National Cheng Kung UniversityLAiMM Laboratory

W07 · H1 · Machine Learning in Engineering Science

Open the sequence notebook

Run setup and inspect the synthetic sensor before fitting anything.

Open H1 notebookRun setupInspect signalState forecast task
Mechanism diagram / illustrative teaching values
Machine Learning in Engineering Science · 19 Oct 202638:00–40:00 · 20/30
National Cheng Kung UniversityLAiMM Laboratory

W07 · H1 · Machine Learning in Engineering Science

Check the window indices

A correct shape is insufficient if the window contains its target.

X[i] = signal[t−24:t] y[i] = signal[t]

t−4t−3t−2t−1tWindow 1t−3t−2t−1tt+1Window 2t−2t−1tt+1t+2Window 3History shifts forward; target stays excluded
Mechanism diagram / illustrative teaching values
Machine Learning in Engineering Science · 19 Oct 202640:00–42:00 · 21/30
National Cheng Kung UniversityLAiMM Laboratory

W07 · H1 · Machine Learning in Engineering Science

Compare linear memory with learned state

Ridge uses fixed window positions; LSTM updates a shared recurrent state.

Ridge: flattened 24-value windowALSTM: 24 shared state updatesB
Mechanism diagram / illustrative teaching values
Machine Learning in Engineering Science · 19 Oct 202642:00–44:00 · 22/30
National Cheng Kung UniversityLAiMM Laboratory

W07 · H1 · Machine Learning in Engineering Science

Map the implementation to tensor axes

batch_first changes input/output layout, not hidden-state layout.

input: (B,T,1) states: (B,T,H) hₙ: (layers,B,H)

Input B×T×1Output B×T×16Head B×1
Mechanism diagram / illustrative teaching values
Machine Learning in Engineering Science · 19 Oct 202644:00–46:00 · 23/30
National Cheng Kung UniversityLAiMM Laboratory

W07 · H1 · Machine Learning in Engineering Science

Training and selection use different data

Gradient updates use training; checkpoint selection uses validation.

Training lossBackward + optimizerValidation lossRetain best state
Mechanism diagram / illustrative teaching values
Machine Learning in Engineering Science · 19 Oct 202646:00–48:00 · 24/30
National Cheng Kung UniversityLAiMM Laboratory

W07 · H1 · Machine Learning in Engineering Science

A loss curve must come from the run

Inspect actual training and validation trajectories in your notebook.
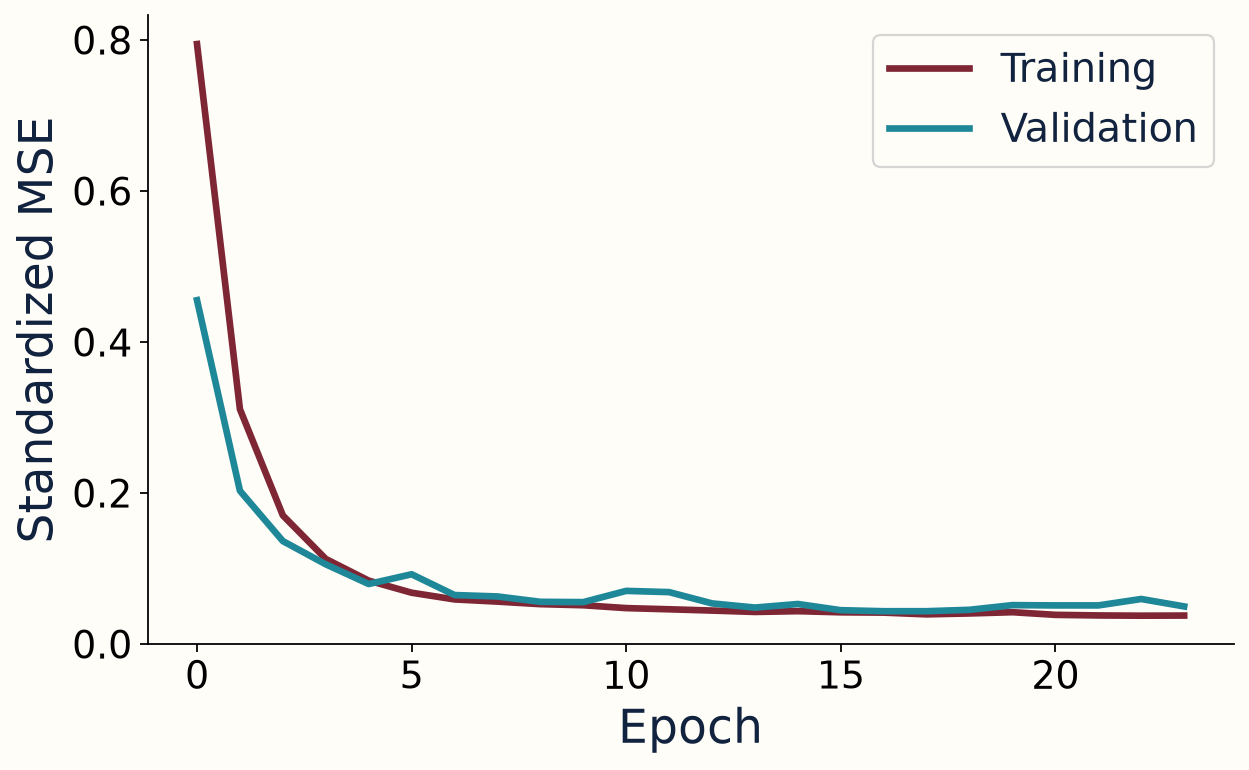
A loss curve must come from the run — actual CPU notebook output on synthetic teaching data
Actual CPU notebook run · synthetic teaching data
Machine Learning in Engineering Science · 19 Oct 202648:00–50:00 · 25/30
National Cheng Kung UniversityLAiMM Laboratory

W07 · H1 · Machine Learning in Engineering Science

Judge errors in the original units

MAE averages error magnitude; RMSE emphasizes large residuals.

MAE = mean |ŷ−y| RMSE = √mean(ŷ−y)²
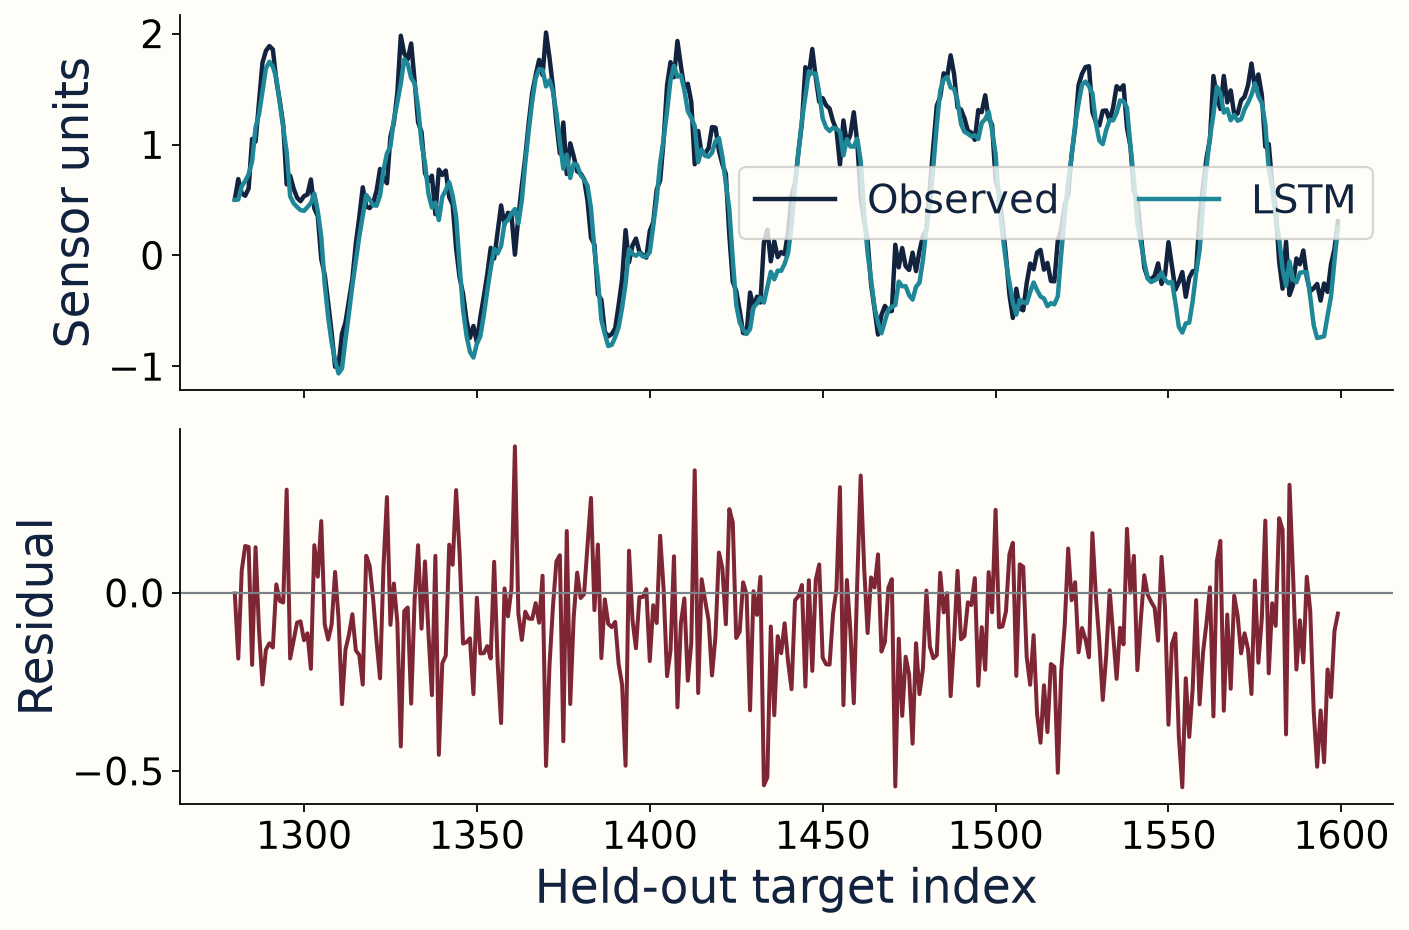
Judge errors in the original units — actual CPU notebook output on synthetic teaching data
Actual CPU notebook run · synthetic teaching data
Machine Learning in Engineering Science · 19 Oct 202650:00–52:00 · 26/30
National Cheng Kung UniversityLAiMM Laboratory

W07 · H1 · Machine Learning in Engineering Science

A trained gate can be reconstructed

PyTorch concatenates its learned gate parameters in i, f, g, o order.

linear projections → split → activations → cell update
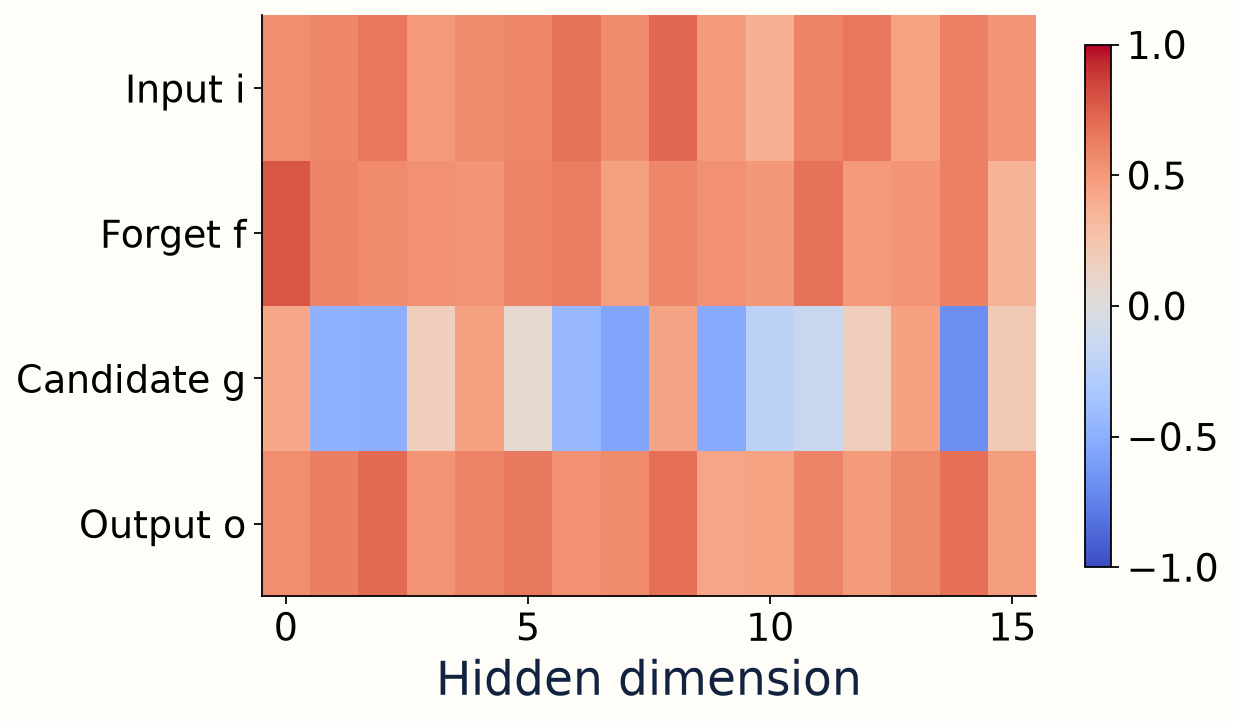
A trained gate can be reconstructed — actual CPU notebook output on synthetic teaching data
Actual CPU notebook run · synthetic teaching data
Machine Learning in Engineering Science · 19 Oct 202652:00–54:00 · 27/30
National Cheng Kung UniversityLAiMM Laboratory

W07 · H1 · Machine Learning in Engineering Science

Reproduce one controlled change

Change window length while preserving the forecast question and split boundaries.

Reference: WINDOW = 24AIntervention: WINDOW = 12 or 48B
Mechanism diagram / illustrative teaching values
Machine Learning in Engineering Science · 19 Oct 202654:00–56:00 · 28/30
National Cheng Kung UniversityLAiMM Laboratory

W07 · H1 · Machine Learning in Engineering Science

LSTM helps; it does not guarantee memory

Retention depends on learned gates, sequence structure, and optimization.

direct memory factor ≈ ∏ fⱼ

f = 0.5f = 0.9f = 0.99Steps backward: 0 → 100Direct-path factor fᵏ
Mechanism diagram / illustrative teaching values
Machine Learning in Engineering Science · 19 Oct 202656:00–58:00 · 29/30
National Cheng Kung UniversityLAiMM Laboratory

W07 · H1 · Machine Learning in Engineering Science

Summary: order, memory, evidence

Order defines the task. LSTM gates control what memory is kept, written, and exposed.

cₜ = fₜ ⊙ cₜ₋₁ + iₜ ⊙ gₜ hₜ = oₜ ⊙ tanh(cₜ)

Ordered historyUse only the available pastGated memoryKeep old state + write new contentForecast evidenceCompare baselines; preserve the runNEXT: attention retrieves relevant earlier states
Mechanism diagram / illustrative teaching values
Machine Learning in Engineering Science · 19 Oct 202658:00–60:00 · 30/30

← → navigate · N notes · R answer · O overview · F fullscreen
